


কৃত্রিম বুদ্ধিমত্তা বা আর্টিফিশিয়াল ইন্টেলিজেন্স (এআই) এখন আর কল্পবিজ্ঞানের বিষয় নয়, বরং এটি আমাদের দৈনন্দিন জীবনের এক অবিচ্ছেদ্য অংশে পরিণত...
 শিক্ষা খাতে কৃত্রিম বুদ্ধিমত্তা: ইউরোপের চিত্র এবং উচ্চশিক্ষায় রূপান্তর
2
শিক্ষা খাতে কৃত্রিম বুদ্ধিমত্তা: ইউরোপের চিত্র এবং উচ্চশিক্ষায় রূপান্তর
2
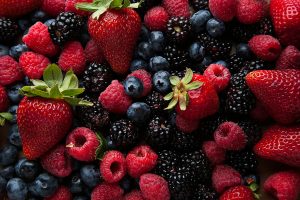
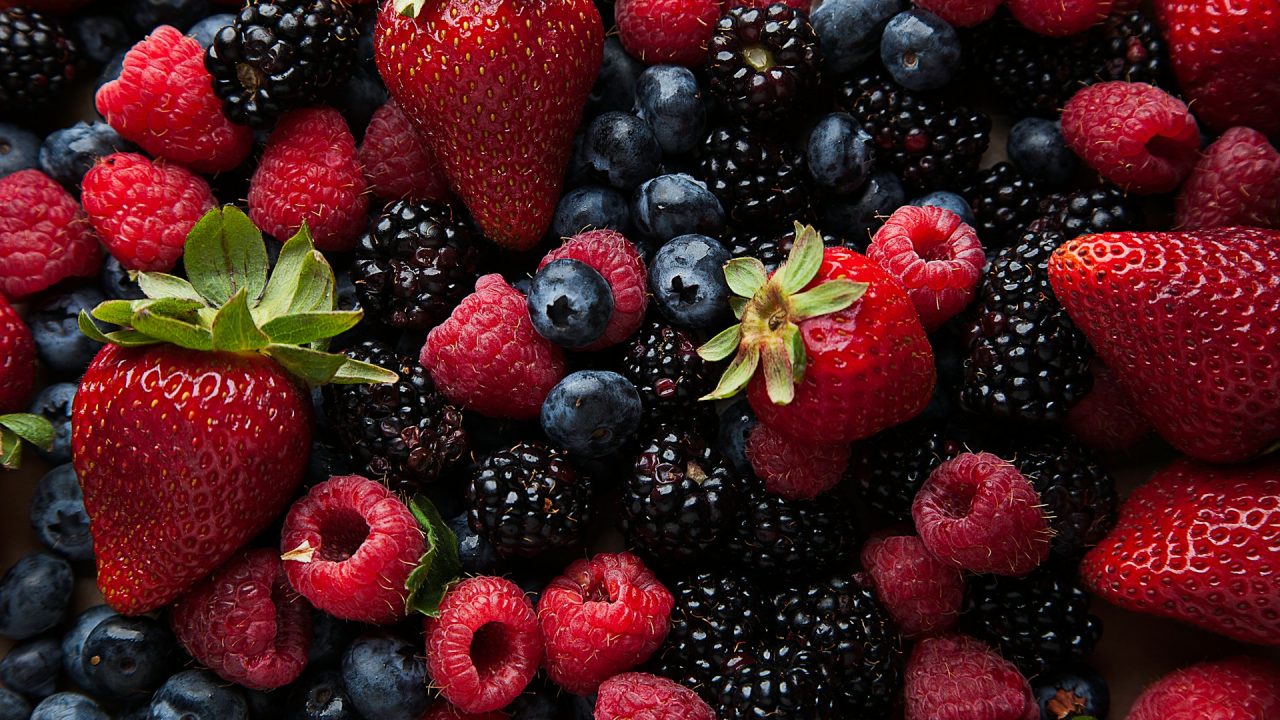
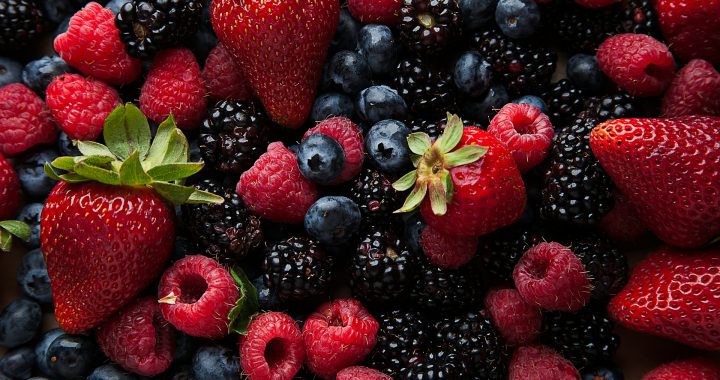
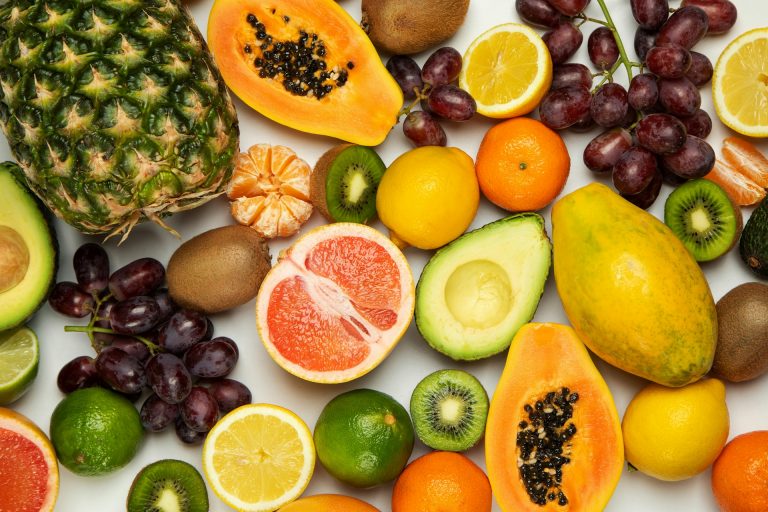
 বিশ্বজুড়ে ফলের বাজারের ব্যাপক প্রবৃদ্ধি ও দেশীয় কামরাঙার পুষ্টিগুণ: একটি সামগ্রিক পর্যালোচনা
3
বিশ্বজুড়ে ফলের বাজারের ব্যাপক প্রবৃদ্ধি ও দেশীয় কামরাঙার পুষ্টিগুণ: একটি সামগ্রিক পর্যালোচনা
3
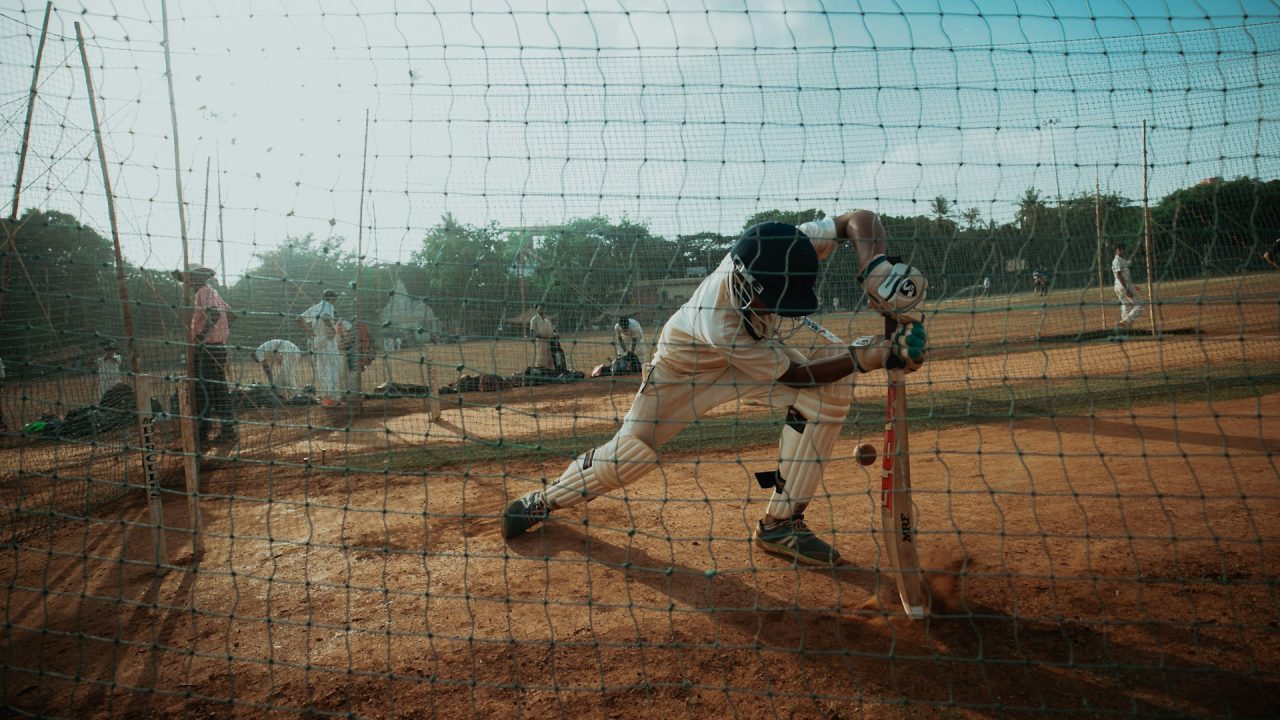
 ক্রিকেটের দুই ভিন্ন চিত্র: অ্যাডিলেইডে রোমাঞ্চের অপেক্ষা আর রাজকোটে প্রোটিয়াদের সান্ত্বনার জয়
4
ক্রিকেটের দুই ভিন্ন চিত্র: অ্যাডিলেইডে রোমাঞ্চের অপেক্ষা আর রাজকোটে প্রোটিয়াদের সান্ত্বনার জয়
4
 মার্কিন শিক্ষায় কৃত্রিম বুদ্ধিমত্তা: স্কুল পর্যায়ে অনাস্থা, বিশ্ববিদ্যালয়ে সাদর গ্রহণ
5
মার্কিন শিক্ষায় কৃত্রিম বুদ্ধিমত্তা: স্কুল পর্যায়ে অনাস্থা, বিশ্ববিদ্যালয়ে সাদর গ্রহণ
5
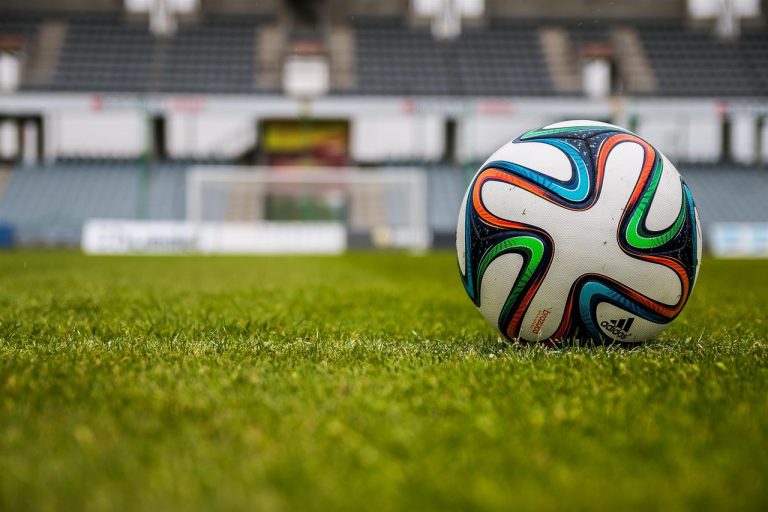
 ইউভেন্তুসকে হারিয়েও পিএসজির গ্রুপ সেরা হতে না পারার হতাশা
কৃত্রিম বুদ্ধিমত্তা বা আর্টিফিশিয়াল ইন্টেলিজেন্স (এআই) এখন আর কল্পবিজ্ঞানের বিষয় নয়, বরং এটি আমাদের দৈনন্দিন জীবনের এক অবিচ্ছেদ্য অংশে পরিণত...
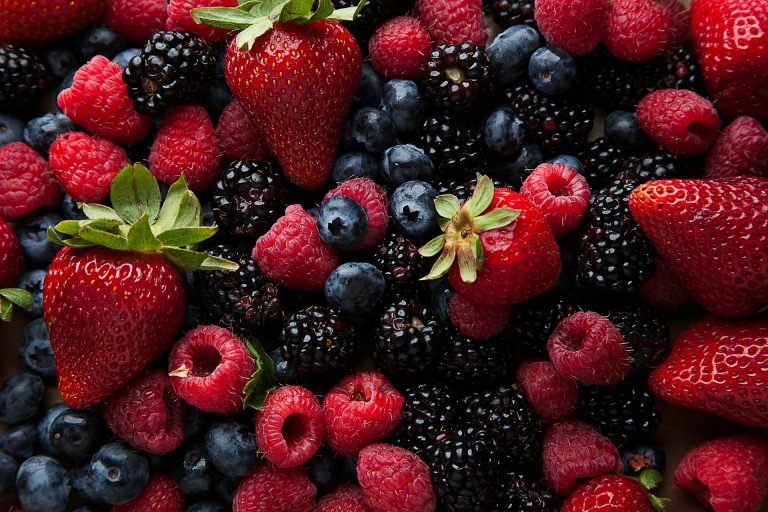
বিশ্বব্যাপী মানুষের মধ্যে স্বাস্থ্যসচেতনতা বৃদ্ধির সঙ্গে সঙ্গে খাদ্যাভ্যাসেও বড় ধরনের পরিবর্তন লক্ষ্য করা যাচ্ছে। বিশেষ করে পুষ্টিকর ও ভেষজ গুণসম্পন্ন...

ক্রিকেট বিশ্বের নজর এখন অস্ট্রেলিয়ার মাটিতে চলমান টি-টোয়েন্টি বিশ্বকাপের দিকে, যেখানে অ্যাডিলেইড ওভাল প্রস্তুত হচ্ছে ভারত ও বাংলাদেশের মধ্যকার হাই-ভোল্টেজ...

আমেরিকানরা যখন তাদের জীবনে কৃত্রিম বুদ্ধিমত্তার (এআই) প্রভাবের সাথে খাপ খাইয়ে নিচ্ছে, তখনও এটি নিয়ে উল্লেখযোগ্য পরিমাণে অবিশ্বাস রয়ে গেছে।...
গ্রুপ সেরা হয়ে নকআউট পর্বে যেতে জয়ের কোনো বিকল্প ছিল না পিএসজির সামনে। ইতালির তুরিনে ইউভেন্তুসের কড়া চ্যালেঞ্জ সামলে তারা...
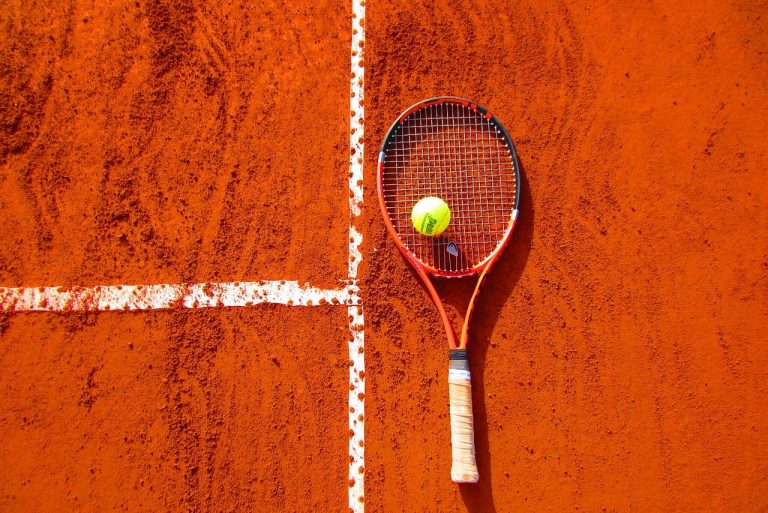
ইউএস ওপেনের ফাইনালে রোমাঞ্চকর এক লড়াইয়ের পর টেনিস বিশ্বের দুই শীর্ষ তারকা কার্লোস আলকারাজ এবং ইয়ানিক সিনার এবার এশিয়ান সুইংয়ে...
প্রচণ্ড গরমে স্বস্তি পেতে আমরা নানা রকম পানীয় ও ফল খেয়ে থাকি। এই সময়ে দেশীয় ফল বাতাবি লেবুর (জাম্বুরা) কদর...

দক্ষিণ কোরিয়ার রাজধানী সিউলে আয়োজিত হতে যাচ্ছে ‘২০২৫ বই, উদ্ভিদ, করাত সম্মেলন’, যা শিশুসাহিত্য এবং প্রকাশনা শিল্পের ভবিষ্যৎ নিয়ে আলোচনার...
ফুটবল মাঠে আর্জেন্টিনার জয়রথ ছুটছেই। বিশ্বকাপ বাছাইপর্বের ম্যাচে ভেনিজুয়েলার বিপক্ষে ৩-০ গোলের সহজ জয় পেয়েছে বর্তমান বিশ্বচ্যাম্পিয়নরা। দলের এই জয়ে...

দীর্ঘ ছয় মৌসুম পর ইতালীয় বাস্কেটবল ক্লাব ডায়নামো ব্যাঙ্কো ডি সার্ডিনিয়াতে আবারও ফিরে এসেছেন তারকা খেলোয়াড় আকিল পোলোনারা। ক্লাব কর্তৃপক্ষ...