


সামনেই বিধানসভা নির্বাচন, আর তার আগেই রাজ্যের শিক্ষা খাতে একটা বড়সড় নড়াচড়া চোখে পড়ছে। নবান্ন থেকে সবুজ সংকেত মেলার পর...
 শিক্ষাব্যবস্থায় জোড়া স্বস্তি: একদিকে ভোটের আগে নিয়োগের তৎপরতা, অন্যদিকে পাঠ্যক্রমে স্বস্তি
2
শিক্ষাব্যবস্থায় জোড়া স্বস্তি: একদিকে ভোটের আগে নিয়োগের তৎপরতা, অন্যদিকে পাঠ্যক্রমে স্বস্তি
2
 থ্রিলারের ভিড়ে স্মৃতির খোঁজ: প্রাইম ডে এবং একটি হারিয়ে যাওয়া ভাষার আখ্যান
3
থ্রিলারের ভিড়ে স্মৃতির খোঁজ: প্রাইম ডে এবং একটি হারিয়ে যাওয়া ভাষার আখ্যান
3
 শ্রেণীকক্ষে এআই: কেবলই কৌতূহল নাকি শিক্ষার নতুন চালিকাশক্তি?
4
শ্রেণীকক্ষে এআই: কেবলই কৌতূহল নাকি শিক্ষার নতুন চালিকাশক্তি?
4
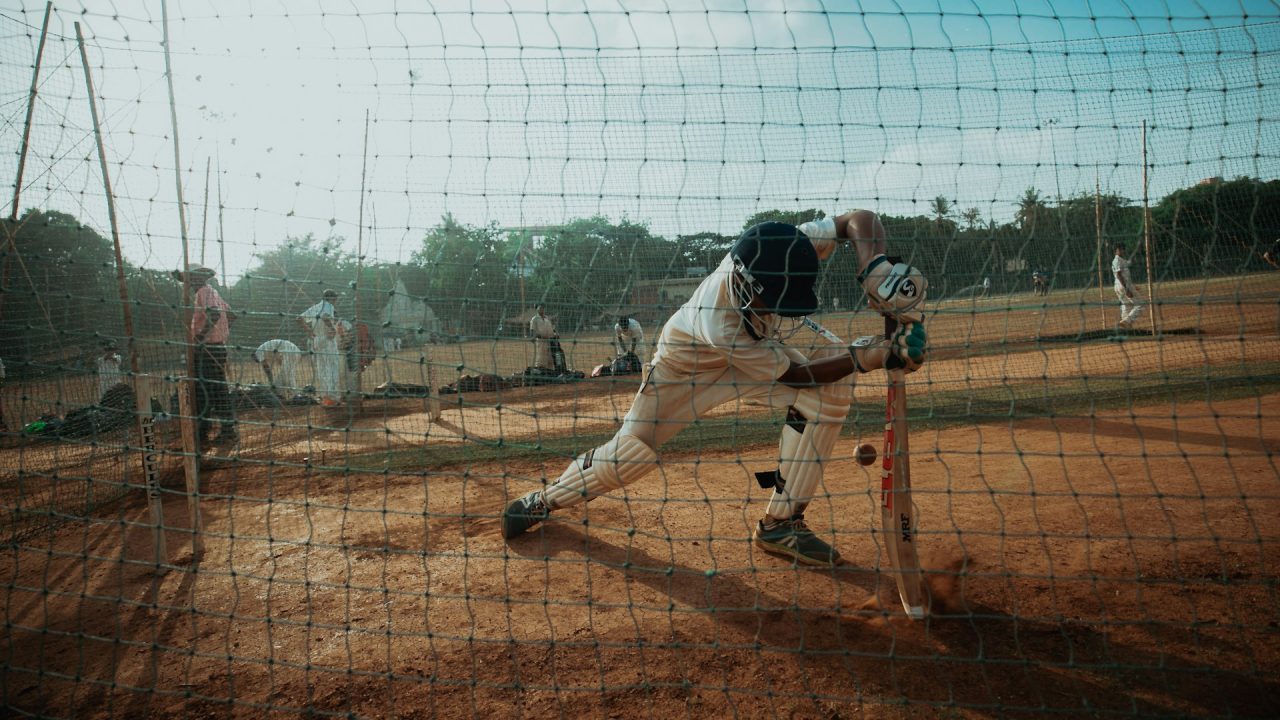
 ক্রিকেটের বাইশ গজ থেকে উইম্বলডনের ঘাস: প্রিটোরিয়ার দাপট এবং ধোনি-ফেদেরার সমীকরণ
5
ক্রিকেটের বাইশ গজ থেকে উইম্বলডনের ঘাস: প্রিটোরিয়ার দাপট এবং ধোনি-ফেদেরার সমীকরণ
5
 সায়েন্স ফিকশন ও ফ্যান্টাসির রূপান্তর: নিলামের কোটি টাকার রেকর্ড থেকে ২০২৬-এর নতুন ধারার বই
সামনেই বিধানসভা নির্বাচন, আর তার আগেই রাজ্যের শিক্ষা খাতে একটা বড়সড় নড়াচড়া চোখে পড়ছে। নবান্ন থেকে সবুজ সংকেত মেলার পর...

২৩ থেকে ২৬ জুন পর্যন্ত অ্যামাজনের প্রাইম ডে চলছে, আর আমি আমাদের বইপাগলদের হোয়াটসঅ্যাপ গ্রুপটায় একের পর এক ডিল শেয়ার...

শিক্ষা খাতে কৃত্রিম বুদ্ধিমত্তা বা এআই-এর ব্যবহার এখন আর কোনো দূরের ভবিষ্যৎ নয়, বরং আমাদের প্রতিদিনের বাস্তবতায় রূপ নিয়েছে। তবে...

সৌরভ গাঙ্গুলীর দল প্রিটোরিয়া ক্যাপিটালস দক্ষিণ আফ্রিকার ঘরোয়া টি-টোয়েন্টি লিগ এসএ২০ (SA20)-তে রীতিমতো উড়ছে। টানা জয়ের হ্যাটট্রিক পূরণ করে তারা...

হেরিটেজ অকশনসের ‘ডেভিড অ্যারোনোভিটজ কালেকশন অব ইম্পর্ট্যান্ট সায়েন্স ফিকশন অ্যান্ড ফ্যান্টাসি পার্ট ১’-এর নিলামের খবরটা সারা বিশ্বের বিরল বইয়ের সংগ্রাহকদের...

বাজারে এআই নিয়ে যত হাঁকডাক আর ভবিষ্যৎবাণী শোনা যায়, বাস্তবের মাটিতে তার প্রয়োগটা ঠিক কেমন? ড্রুইড এআই-এর সদ্য প্রকাশিত ‘২০২৬...

প্রতিদিনের ব্যস্ত জীবনে আমরা অনেকেই একটু দিকনির্দেশনা খুঁজি। গ্রহ-নক্ষত্রের অবস্থান আর ট্যারো কার্ডের রহস্যময় জগৎ আমাদের সেই ভবিষ্যতের পথের সন্ধান...
যুব বিশ্বকাপে পাকিস্তানের বিরুদ্ধে ভারতের লড়াইটা বেশ জমে উঠেছে। সুপার সিক্সের এই গুরুত্বপূর্ণ ম্যাচে ভারতীয় ব্যাটার বৈভবের ৩০ রানের ইনিংসটির...
এবারের টি-টোয়েন্টি বিশ্বকাপে ভারতের রানমেশিন হিসেবে অস্ট্রেলিয়ান কিংবদন্তি রিকি পন্টিংয়ের বাজি ছিলেন তরুণ আগ্রাসী ওপেনার অভিষেক শর্মা। আইসিসি টি-টোয়েন্টি র্যাঙ্কিংয়ের...

একসময় মনে করা হতো এডটেক বা শিক্ষাপ্রযুক্তি বুঝি কেবল মহামারিকালীন এক সাময়িক সমাধান বা ‘কনভিনিয়েন্স’। কিন্তু সেই ধারণা এখন আমূল...